
Backtesting fundamentals
How to manually backtest a trading strategy: A step-by-step guide
Learn how to turn a trading idea into a testable trading plan with clear rules, then compare variations and use backtesting analytics to improve its performance.
Educational content only—not financial advice. Backtests are hypothetical and do not predict future performance.
1. Why backtesting trading strategies matters
You have a trading idea that looks promising. Maybe pullbacks often continue with the higher-timeframe trend. Maybe you want to know whether it is better to enter early or wait for another signal. A few chart examples may look great, but that does not tell you how the idea performs over many trades.
Manual backtesting helps you find out. You move through old chart data without seeing what happens next. At each step, you follow the same trading rules and record the result. This gives you a much clearer picture than scrolling back and picking the best-looking setups. What may take years to evaluate through forward testing can often be tested against historical data within hours.
The main goal of a backtest is to see whether your strategy has a repeatable statistical edge, rather than a few lucky results. This is why the number of trades matters. A small sample can easily be shaped by luck. One large winner or a short losing streak can completely change the result. As you test more trades, these random outcomes usually have less influence and you get a clearer view of the strategy's win rate, average result, losing streaks, and drawdowns. In general, the more, the better, but start with at least 100 valid trades. Aim for 200 or, even better, 500 trades when the strategy and available data allow it.
A backtest can also answer questions such as:
- Which entry, exit, or management criteria work best for this strategy?
- When does the strategy struggle?
- Can I describe the strategy clearly and follow it the same way every time?
- How long can losing streaks be, and how deep can drawdowns become?
2. A complete backtesting framework
A backtesting framework gives you a clear step-by-step process for testing different trading ideas consistently. The following framework takes you from your first trading idea through testing, review, analysis, and improvement.
2.1 Start with a trading idea
Most strategies start with something you notice or learn about. For example, your trading idea could come from trend following, momentum trading, or SMT/ICT concepts, just to name a few. The longer you trade, the more observations you will make yourself that you may want to verify through backtesting.
The name of the method is not yet a strategy. “Trade with momentum” and “use ICT” are too broad. You need to state exactly what you want to test.
For example:
During a higher-timeframe uptrend, does waiting for bullish confirmation on a lower timeframe lead to better entries than buying the first pullback?
This is a hypothesis, which simply means a trading idea that you want to test. The more well-defined hypotheses you test, the more chances you have to find an approach with a real statistical edge. However, testing many ideas also makes it more likely that one will look successful purely by luck, so always test promising results again on fresh market data.
2.2 Turn the idea into clear trading rules
Clear rules help you make consistent decisions instead of changing your approach based on emotion. They also ensure that every trade tests the same strategy, so the results are meaningful. You know that your rule set is clear enough when another trader can read it and make roughly the same decision at the same point on the chart.
“Buy when the market looks bullish” is not clear enough. You need rules for the market environment, the entry, and what happens after the entry.
2.2.1 Choose the market environment
First, decide where and when you will trade:
- Which instrument or group of instruments?
- Which days and trading sessions?
- Which timeframes will you use?
- Will you avoid important news? If yes, for how long before and after it?
- Can trades stay open overnight or over the weekend?
- Can more than one trade be open at the same time?
One important point about choosing timeframes: multi-timeframe analysis can greatly improve a strategy by using higher timeframes for market context and lower timeframes for more precise entries and exits. Traders should include it in their testing, as long as every timeframe has a clear purpose.
For example:
- Daily and 4-hour charts: find the main direction.
- 1-hour chart: find the area where you want to trade.
- 5-minute chart: enter and manage the trade.
2.2.2 Write the entry rules
Your entry rules should answer:
- Which conditions must be present?
- Which conditions must not be present?
- On which timeframe must that trigger happen?
- Where will the stop loss (SL) and take profit (TP) go?
- What is the minimum planned reward-to-risk ratio?
As an example, “Enter after confirmation” leaves too much room for interpretation. A clearer rule could be: “Enter long after price pulls back to the planned area during a bullish 1-hour trend and a 5-minute candle closes above the previous candle's high.” Your own entry rule may be different, but it should be just as specific.
The reward-to-risk ratio (RR) is often overvalued. It only becomes meaningful when you look at it together with the win rate. A strategy with an RR below 1:1 can still be profitable if it wins often enough, while a strategy with a high RR can lose money if winning trades are too rare. Always judge the two together.
2.2.3 Write the exit and management rules
Plan the trade before you enter it:
- When may you tighten the stop loss?
- When will you move the stop to break-even?
- Will you take partial profits?
- Will you close the trade at a certain time?
- Under which conditions will you exit early?
As with the entry rules, be specific. “Exit when momentum becomes weak” leaves too much room for hindsight. A clearer rule could be: “Exit after two bearish conditions close on the 5-minute chart while the 1-hour bias is no longer bullish.” Your own rule may be different, but it must be decided before you see the result.
2.3 Backtest the strategy
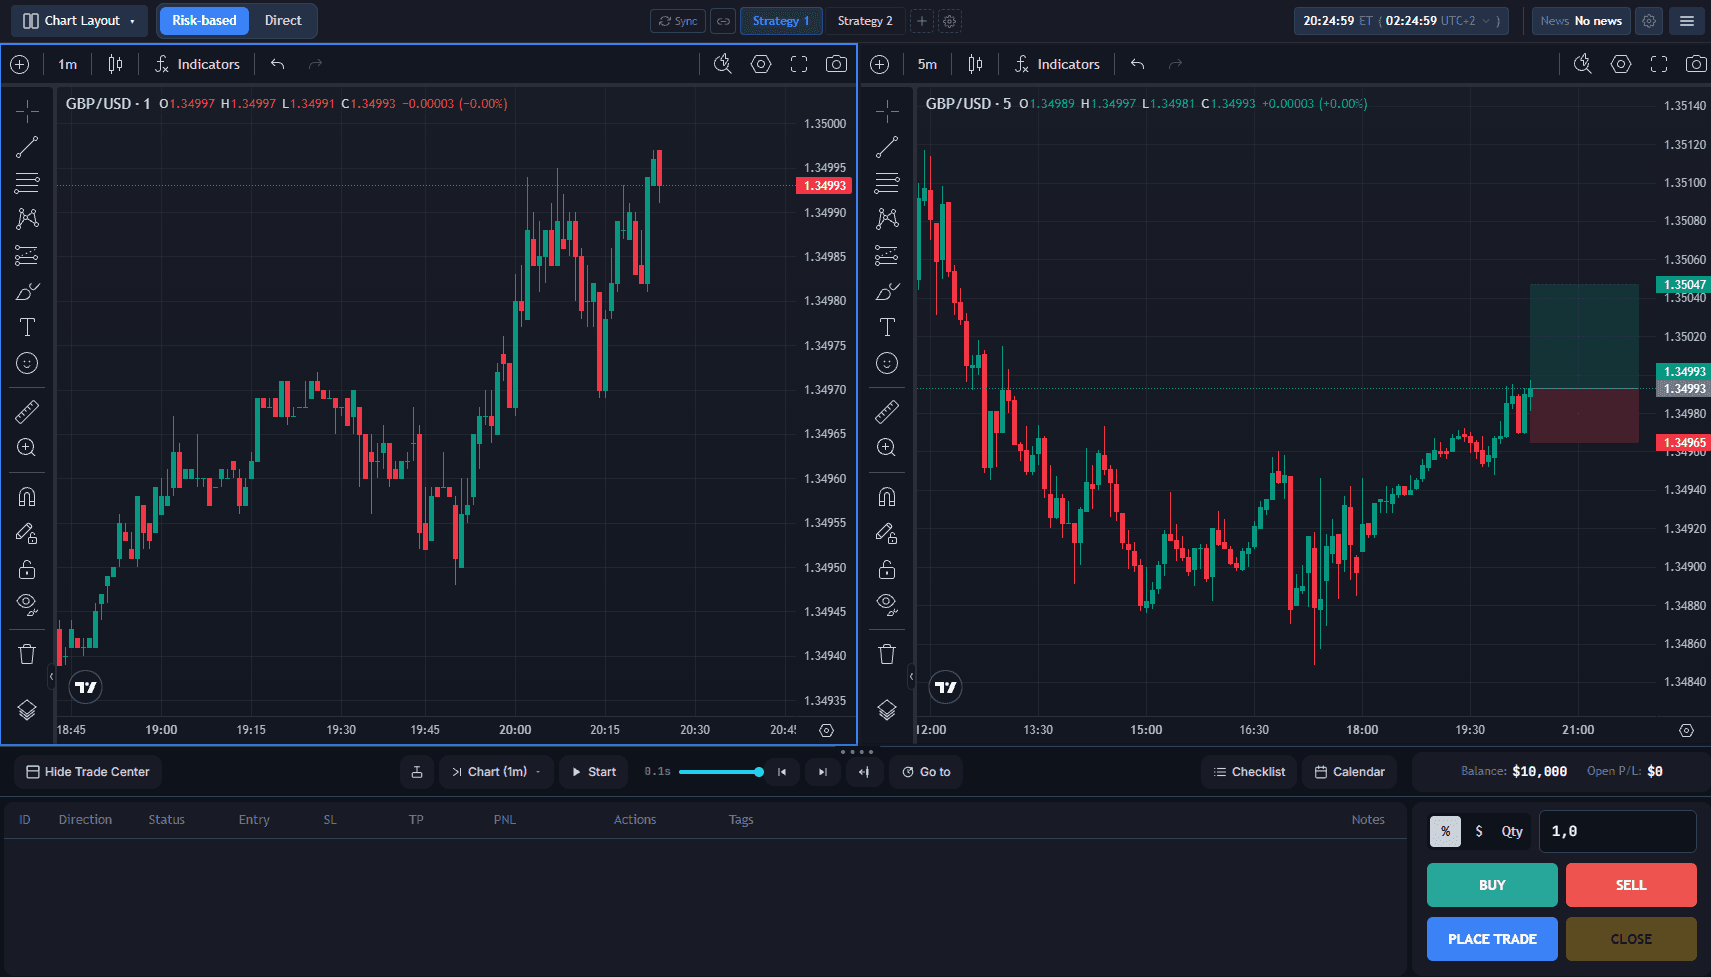
Now move through the historical chart and apply the rules to every valid setup in the same way. Put the important environment, entry, and management rules into checklists, and complete the relevant checklist before taking or changing a trade.
ChartLooper's hotkeys help you move through replay and complete common trade actions with less mouse movement, and you can customize them to fit your workflow. Faster controls should save time, not change which setups you record or how you apply the rules.
If you think of a better rule during the test, write it down for the next strategy version. Do not change the old rule halfway through and pretend that every trade followed the new one.
Also attach tags to your trades. Tags are short, custom labels you add to trades. Because ChartLooper lets you filter trading performance by tags, they can become one of the most powerful tools for learning what works and what does not. A tag can capture any observation that you define and apply consistently. Useful examples include:
- good, mediocre, or poor setup;
- higher and lower timeframes aligned or not aligned;
- trending or ranging market;
- rules followed or rules broken.
Define your tags before the test so that a win or loss does not change how you label a setup. Add a short note about what you knew when you made the decision; this preserves details that a tag alone cannot explain.
2.4 Review every trade
After the backtest, go through the historical trades instead of looking only at the final numbers. Reviewing each trade helps you spot broken rules, execution mistakes, and useful patterns that summary statistics can hide. Also review winners and losers in the same way. A winning trade can break the rules. A losing trade can be a perfectly correct trade. The result of one trade does not tell you whether the decision was good.
For each trade, ask:
- Did I follow the rules?
- Is there an entry, exit, or trade management variation worth testing next?
- Is there a pattern worth testing next?
For example, an entry variation may slightly change one entry condition or require one more confirming signal before entering. Record it as a new idea to test rather than changing the current strategy during the backtest.
If you notice a useful new tag during the review, define it clearly and apply it to all relevant trades, not only the winners. Treat anything you discover this way as a new idea to test, not as final proof.
2.5 Analyze your results
Analyzing the results turns a list of trades into useful lessons. The total result alone does not tell you why the strategy worked, where it struggled, or whether a few unusual trades shaped the outcome.
Start with the main numbers: trade count, win rate, average result in R, profit factor, and maximum drawdown. Then explore the dimensions that may explain those numbers. The most useful ones are often tags and tag combinations because they connect performance to the conditions and observations you recorded during the backtest. This helps you see which individual factors—or combinations of factors—were present in stronger or weaker trades. For example, the tag higher-timeframe aligned could mean that the trade direction matched the direction on your chosen higher timeframe. The tag strong confluence could mean that several predefined supporting conditions were active when you entered. You can compare the performance of trades with different tags to see which observations are associated with stronger or weaker results. Similarly, you can group tags and compare those combinations to find conditions that may work well together.
2.6 Improve the strategy and test again
Analysis becomes useful when it helps you adapt the strategy to the conditions linked to better performance. If trades with higher-timeframe alignment and strong confluence produced stronger results, a refined strategy could require one or both conditions before an entry. Conditions linked to weaker results may point to situations the strategy should avoid.
The refined strategy must also be tested on data that was not used to create it. Reusing the same chart period can lead to overfitting, which means the strategy fits the specific data or instrument that was tested but does not work as well elsewhere. Test it on other time periods and, if the strategy is intended to work across markets, on other instruments. Similar results across different samples provide stronger evidence that the improvement is not limited to one dataset, although they still cannot guarantee future performance. You can read more in the original paper on the probability of backtest overfitting.
3. Test different strategy versions
Testing variations of your entry, exit, and trade-management rules helps you optimize a strategy instead of accepting its first version. The comparison should show which rule produces a better balance of trade frequency, win rate, average result, and drawdown for the strategy you want to trade.
Imagine that the original version enters at the first touch of a planned area during a bullish 1-hour trend, places the stop loss below the pullback, and uses a fixed 2R take profit. An entry variation could keep every other rule the same but wait for a 5-minute candle to close above the previous candle's high. This comparison shows what changes when you wait for confirmation: you may take fewer trades, but those trades may have a different win rate, average result, or drawdown.
You can test exit and management variations in the same way. One version could keep the fixed 2R target while another exits at a predefined market structure level. A management comparison could leave the original stop loss unchanged in one version and move it to break-even after price reaches 1R in another. Keeping the remaining rules the same makes it easier to understand which variation caused the difference.
ChartLooper's multi-strategy testing lets you run these versions in the same backtesting session. You analyze the market once and then enter or manage each strategy according to its own rules at the same point in the chart. This saves time, keeps the market context consistent, and makes the results of each entry, exit, or management variation easier to compare.
4. How many trades should you test?
In general, the more, the better, but start with at least 100 valid trades. Aim for 200 or, even better, 500 trades when the strategy and available data allow it. More trades reduce the influence of a few lucky wins or unlucky losses.
The table shows the approximate 95% margin of error for a measured win rate.
| Number of trades | Approximate margin of error |
|---|---|
| 10 | ±31.0 percentage points |
| 30 | ±17.9 percentage points |
| 50 | ±13.9 percentage points |
| 100 | ±9.8 percentage points |
| 200 | ±6.9 percentage points |
| 500 | ±4.4 percentage points |
| 1,000 | ±3.1 percentage points |
A margin of error of ±9.8 percentage points means that a measured win rate may be about 9.8 points higher or lower than the strategy's underlying win rate. For example, if 100 trades produce a 65% win rate, the underlying win rate could be roughly between 55.2% and 74.8%. With 500 trades, the smaller margin of ±4.4 points narrows that range to about 60.6% to 69.4%. This narrower range means that the measured win rate is likely to be closer to the underlying win rate. This reflects a general principle of statistics: larger, representative samples reduce the effect of random outcomes and usually make test results more reliable.
Put the workflow into practice
Replay historical charts, follow your rules with checklists, tag and review your trades, and compare strategy variations in one session.